| | | | | |
| Incidence dans le Finistère : Femmes |
| Période | Cas | Taux bruts | Taux stand. Europe | Taux stand. Monde | |
| 1984-1988 | 6 | 0,28 ± 0,11 | 0,24 ± 0,10 | 0,18 ± 0,08 | |
| 1989-1993 | 12 | 0,56 ± 0,16 | 0,38 ± 0,12 | 0,26 ± 0,09 | |
| 1994-1998 | 28 | 1,29 ± 0,24 | 0,87 ± 0,18 | 0,59 ± 0,13 | |
| 1999-2003 | 21 | 0,94 ± 0,21 | 0,66 ± 0,16 | 0,49 ± 0,13 | |
| 2004-2008 | 28 | 1,23 ± 0,23 | 0,81 ± 0,17 | 0,58 ± 0,13 | |
| 2009-2012 | 17 | 0,91 ± 0,22 | 0,58 ± 0,16 | 0,41 ± 0,12 | |
| | | | | |
| | | | | |
| Incidence dans le Finistère : Hommes |
| Période | Cas | Taux bruts | Taux stand. Europe | Taux stand. Monde | |
| 1984-1988 | 5 | 0,25 ± 0,11 | 0,25 ± 0,11 | 0,19 ± 0,09 | |
| 1989-1993 | 17 | 0,84 ± 0,20 | 0,78 ± 0,19 | 0,55 ± 0,14 | |
| 1994-1998 | 17 | 0,83 ± 0,20 | 0,74 ± 0,18 | 0,56 ± 0,14 | |
| 1999-2003 | 21 | 1,01 ± 0,22 | 0,86 ± 0,19 | 0,62 ± 0,14 | |
| 2004-2008 | 22 | 1,03 ± 0,22 | 0,85 ± 0,19 | 0,61 ± 0,14 | |
| 2009-2012 | 20 | 1,14 ± 0,25 | 0,96 ± 0,22 | 0,74 ± 0,18 | |
| | | | | |
| | | | | |
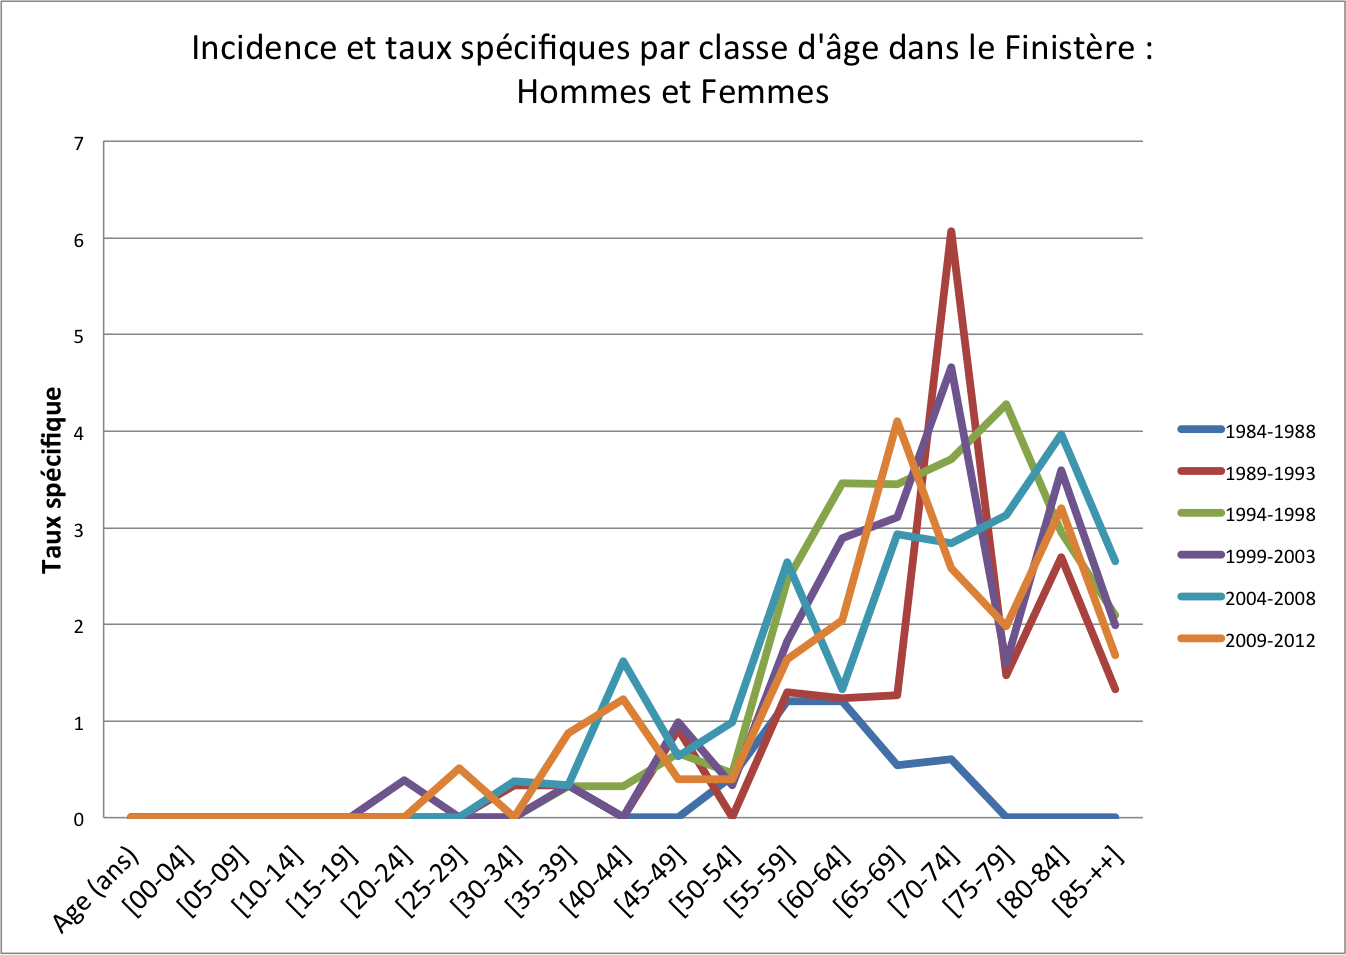
| Incidence dans le Finistère : Hommes et Femmes | | | |
| Période | Cas | Taux bruts | Taux stand. Europe | Taux stand. Monde | Sexe Ratio |
| 1984-1988 | 11 | 0,26 ± 0,08 | 0,25 ± 0,08 | 0,19 ± 0,06 | 1,05 |
| 1989-1993 | 29 | 0,69 ± 0,13 | 0,55 ± 0,11 | 0,39 ± 0,08 | 2,09 |
| 1994-1998 | 45 | 1,06 ± 0,16 | 0,83 ± 0,13 | 0,58 ± 0,09 | 0,95 |
| 1999-2003 | 42 | 0,97 ± 0,15 | 0,75 ± 0,12 | 0,55 ± 0,09 | 1,25 |
| 2004-2008 | 50 | 1,13 ± 0,16 | 0,83 ± 0,13 | 0,60 ± 0,09 | 1,04 |
| 2009-2012 | 37 | 1,02 ± 0,17 | 0,77 ± 0,13 | 0,58 ± 0,11 | 1,79 |
| | | | | |