| | | | | |
| Incidence dans le Finistère : Femmes |
| Période | Cas | Taux bruts | Taux stand. Europe | Taux stand. Monde | |
| 1984-1988 | 764 | 35,54 ± 1,29 | 24,63 ± 0,96 | 16,85 ± 0,70 | |
| 1989-1993 | 1013 | 46,88 ± 1,47 | 30,13 ± 1,05 | 20,19 ± 0,75 | |
| 1994-1998 | 1095 | 50,27 ± 1,52 | 30,54 ± 1,03 | 20,69 ± 0,74 | |
| 1999-2003 | 1187 | 53,37 ± 1,55 | 31,38 ± 1,02 | 21,37 ± 0,75 | |
| 2004-2008 | 1457 | 63,80 ± 1,67 | 34,75 ± 1,03 | 23,18 ± 0,75 | |
| 2009-2012 | 1214 | 64,88 ± 1,86 | 34,29 ± 1,12 | 23,11 ± 0,81 | |
| | | | | |
| | | | | |
| Incidence dans le Finistère : Hommes |
| Période | Cas | Taux bruts | Taux stand. Europe | Taux stand. Monde | |
| 1984-1988 | 962 | 47,64 ± 1,54 | 44,32 ± 1,46 | 29,95 ± 1,01 | |
| 1989-1993 | 1279 | 62,92 ± 1,76 | 55,85 ± 1,60 | 37,28 ± 1,10 | |
| 1994-1998 | 1384 | 67,49 ± 1,81 | 57,11 ± 1,57 | 38,18 ± 1,08 | |
| 1999-2003 | 1479 | 70,78 ± 1,84 | 56,27 ± 1,5 | 37,76 ± 1,05 | |
| 2004-2008 | 1653 | 77,26 ± 1,90 | 57,53 ± 1,46 | 38,39 ± 1,02 | |
| 2009-2012 | 1472 | 83,76 ± 2,18 | 59,83 ± 1,61 | 40,15 ± 1,13 | |
| | | | | |
| | | | | |
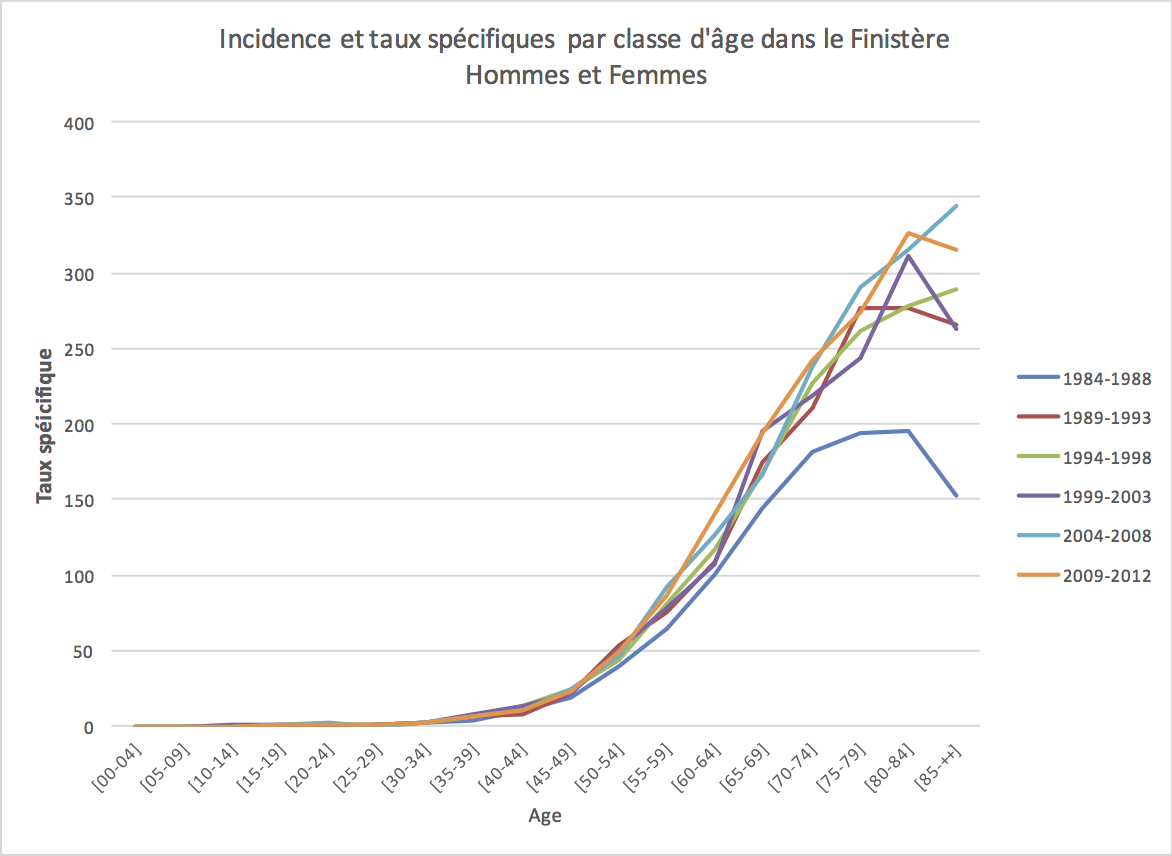
| Incidence dans le Finistère : Hommes et Femmes | | | |
| Période | Cas | Taux bruts | Taux stand. Europe | Taux stand. Monde | Sexe Ratio |
| 1984-1988 | 1726 | 41,40 ± 1,00 | 32,72 ± 0,82 | 22,34 ± 0,59 | 1,78 |
| 1989-1993 | 2292 | 54,65 ± 1,14 | 40,77 ± 0,90 | 27,41 ± 0,63 | 1,85 |
| 1994-1998 | 2479 | 58,62 ± 1,18 | 41,56 ± 0,89 | 28,09 ± 0,63 | 1,84 |
| 1999-2003 | 2666 | 61,80 ± 1,20 | 41,88 ± 0,87 | 28,40 ± 0,62 | 1,77 |
| 2004-2008 | 3110 | 70,31 ± 1,26 | 44,51 ± 0,86 | 29,84 ± 0,62 | 1,66 |
| 2009-2012 | 2686 | 74,02 ± 1,43 | 45,59 ± 0,95 | 30,79 ± 0,68 | 1,74 |
| | | | | |