| | | | | | |
| Incidence dans le Finistère : Femmes |
| Période | Cas | Taux bruts | Taux stand. Europe | Taux stand. Monde | |
| 1984-1988 | 21 | 0,98 ± 0,21 | 0,69 ± 0,16 | 0,48 ± 0,12 | |
| 1989-1993 | 29 | 4,6 ± 0,45 | 0,92 ± 0,18 | 0,63 ± 0,12 | |
| 1994-1998 | 21 | 5,24 ± 0,53 | 0,67 ± 0,16 | 0,47 ± 0,12 | |
| 1999-2003 | 49 | 1,34 ± 0,25 | 1,39 ± 0,22 | 0,96 ± 0,16 | |
| 2004-2008 | 105 | 0,96 ± 0,21 | 2,52 ± 0,28 | 1,72 ± 0,22 | |
| 2009-2012 | 98 | 2,2 ± 0,31 | 3,02 ± 0,34 | 2,07 ± 0,25 | |
| | | | | |
| | | | | |
| Incidence dans le Finistère : Hommes |
| Période | Cas | Taux bruts | Taux stand. Europe | Taux stand. Monde | |
| 1984-1988 | 95 | 4,7 ± 0,48 | 4,65 ± 0,48 | 3,32 ± 0,35 | |
| 1989-1993 | 213 | 10,48 ± 0,72 | 9,45 ± 0,66 | 6,69 ± 0,48 | |
| 1994-1998 | 187 | 9,12 ± 0,67 | 7,80 ± 0,58 | 5,37 ± 0,41 | |
| 1999-2003 | 309 | 14,79 ± 0,84 | 12,28 ± 0,72 | 8,62 ± 0,52 | |
| 2004-2008 | 608 | 28,42 ± 1,15 | 21,96 ± 0,92 | 15,14 ± 0,67 | |
| 2009-2012 | 503 | 28,62 ± 1,28 | 20,71 ± 0,95 | 14,01 ± 0,66 | |
| | | | | |
| | | | | |
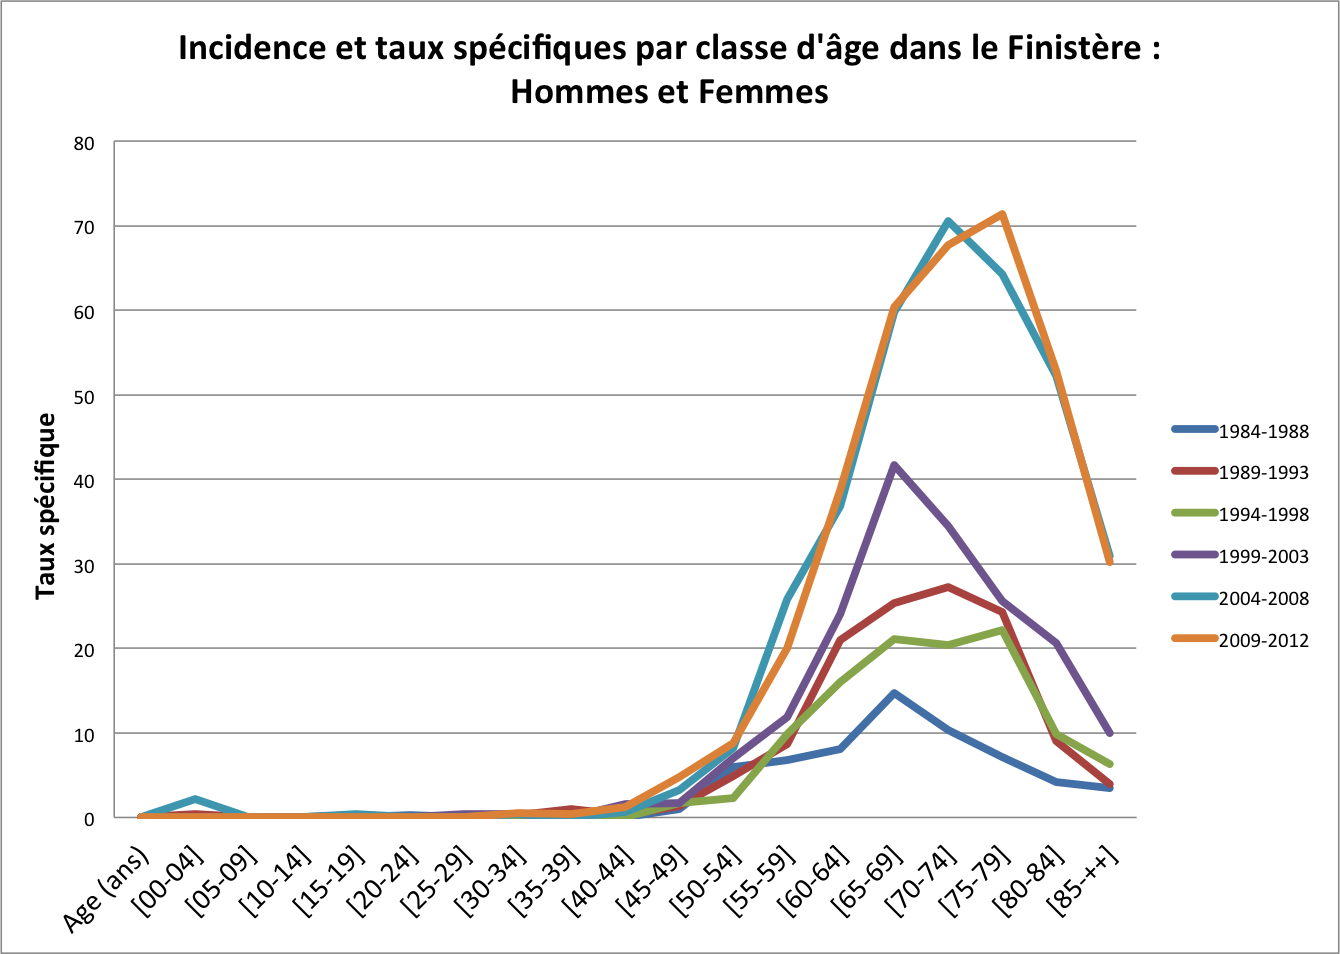
| Incidence dans le Finistère : Hommes et Femmes | | | |
| Période | Cas | Taux bruts | Taux stand. Europe | Taux stand. Monde | Sexe Ratio |
| 1984-1988 | 116 | 2,78 ± 0,26 | 2,46 ± 0,23 | 1,75 ± 0,17 | 6,88 |
| 1989-1993 | 242 | 5,77 ± 0,37 | 4,63 ± 0,31 | 3,31 ± 0,23 | 10,56 |
| 1994-1998 | 208 | 4,92 ± 0,34 | 3,75 ± 0,27 | 2,61 ± 0,19 | 11,52 |
| 1999-2003 | 358 | 8,30 ± 0,44 | 6,21 ± 0,34 | 4,39 ± 0,25 | 8,99 |
| 2004-2008 | 713 | 16,12 ± 0,60 | 11,08 ± 0,44 | 7,72 ± 0,33 | 8,78 |
| 2009-2012 | 601 | 16,56 ± 0,68 | 10,95 ± 0,47 | 7,50 ± 0,34 | 6,77 |
| | | | | |